The Endpoint
According to international guidelines “Bioaccumulation” is defined as the process where the chemical concentration in an aquatic organism achieves a level that exceeds that in the water as a result of chemical uptake through all routes of chemical exposure (e.g. dietary absorption, transport across the respiratory surface, dermal absorption). Bioaccumulation typically takes place under field conditions and is a combination of chemical bioconcentration and biomagnification (the process by which lipid normalized chemical concentrations increase with trophic level in a food-chain). The extent of chemical bioaccumulation is usually expressed in the form of a bioaccumulation factor (BAF), which is the ratio of the chemical concentration in the organism (CB) and the water (CW), including the uptake in the diet.
Bioconcentration is the process where the chemical concentration in an aquatic organism achieves a level that exceeds that in the water as a result of the exposure of an organism to a chemical in the water but does not include exposure via the diet. Bioconcentration refers to a situation, typically derived under controlled laboratory conditions, wherein the chemical is absorbed from the water via the respiratory surface and/or the skin only. The extent of chemical Bioconcentration is usually expressed in the form of a Bioconcentration factor.
The bioconcentration factor (BCF) is the concentration of test substance in/on the fish or specified tissues thereof divided by the concentration of the chemical in the surrounding medium at steady state. In the context of setting exposure criteria it is generally understood that the terms “BCF” and “steady-state BCF” are synonymous. A steady-state condition occurs when the organism is exposed for a sufficient length of time that the ratio does not change substantially.
Bioconcentration factors (BCFs) are used to relate pollutant residues in aquatic organisms to the pollutant concentration in ambient waters. Many chemical compounds, especially those with a hydrophobic component, partition easily into the lipids and lipid membranes of organisms and bioaccumulate.
BCF and BAF are described by the following formulas:
BCF = CB/CWD = k1/(k2 + kE + kM + kG)
BAF = CB/CWD = {k1 + kD (CB/CWD)} / (k2 + kE + kM + kG)
Where CB is the chemical concentration in the organism (g/kg−1), k1 is the chemical uptake rate constant from the water at the respiratory surface (L·kg−1·d−1), CWD is the freely dissolved chemical concentration in the water (g·L−1), kD is the uptake rate constant for chemical in the diet (kg*kg-1*d-1) and k2, kE, kM, kG are rate constants (d−1) representing chemical elimination from the organism via the respiratory surface, fecal egestion, metabolic biotransformation, and growth dilution, respectively.
BCF & REACH
The degree of information requested under REACH varies upon yearly tonnage of production and/or import. In particular among the ecotoxicological information in Point 9.3.2 bioaccumulation is mentioned in the aquatic species, preferably fish. The preferred experimental conditions for BCF test are those reported in the OECD 305 guideline. The number of likely fish recommended for the test is in the range 132 to 240, for a duration of 44-116 days and a cost for each experiment in the range of 50-100 k€.
According to the REACH framework the potential use of BCF information include the following uses:
- Classification & Labelling (C&L): all substances should be assessed for environmental hazard classification. Bioaccumulation potential is one aspect that needs to be considered in relation to long-term effects.
- Prioritization (PBT, vPvB): bioaccumulation is one of the criteria used for the PBT/vPvB assessment. For a definitive conclusion, reliable measured BCF data are generally necessary (for fish or an invertebrate such as molluscs). However, a provisional assessment can be made against screening criteria.
To define if a chemical is PBT or vPvB the thresholds are: for B BCF > 2000 L/kg (whole organism weight) = 3.3 in Log unit vB BCF > 5000 L/kg = 3.7 in Log unit - Chemical Safety Assessment (CSA): fish BCF and BMF (Biomagnification Factor) values are used to calculate concentrations in fish as part of the secondary poisoning assessment for wildlife, as well as for human dietary exposure. An invertebrate BCF may also be used to model a food chain based on consumption of sediment worms or shellfish. An assessment of secondary poisoning or human exposure via the environment will not always be necessary for every substance. In the first instance, a predicted BCF may be used for first tier risk assessment.
As reported in the table below potential use of BCF information in REACH satisfies C&L, B assessment and CSA (up to 100 ton/year), while for production above 100 ton/year a specific definite value become necessary.

Thus, both quantitative and qualitative (classification) evaluation might be requested.
QSAR & BCF for REACH
The PBT and vPvB assessment of a substance shall be based on all relevant information available, which is normally the information that shall be submitted as part of the technical dossier, including the physicochemical, hazard and exposure information generated in the context of the CSA.
Other properties or estimations particularly in relation to Log Kow may be used to infer bioconcentration properties of chemical compounds; thus, beside the general stimulus to QSAR in the REACH legislation, some QSAR-based estimation methods are already mentioned for deducing BCF properties.
Moreover, to properly assess the reliability of a QSAR model prediction a very useful criterion for comparison is represented by the experimental data variability. In the case of BCF the reported experimental uncertainty can be up to 0.75 in Log unit (Dimitrov et al. 2005). In other databases we assessed within CAESAR, the observed experimental variability was in the range of 0.3-0.4 Log units.
The Model
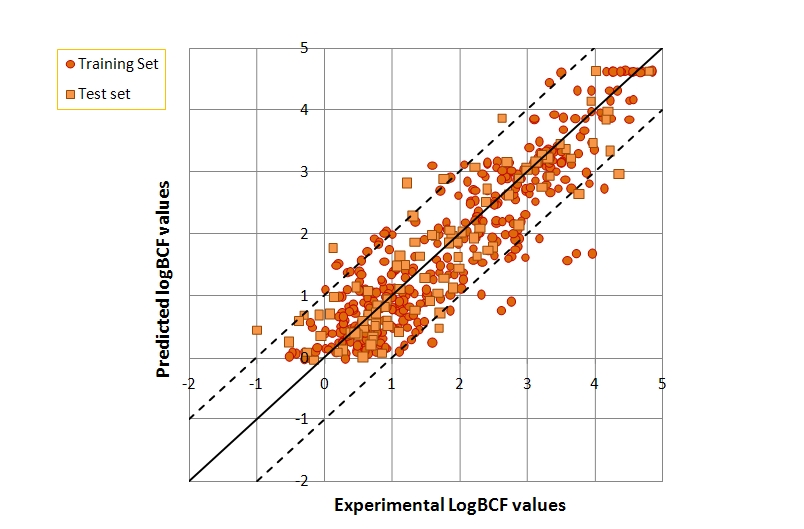
The CAESAR model for BCF is based on a dataset of 473 compounds with experiementally determined BCF values extracted from Dimitrov et al. 2005. This dataset was divided into a training set (378 compounds), used to develop the model and a test (95 compounds) used to assess the performance of the model in prediction. The final model is a Neural Network based on 8 molecular descriptors.
The model is constituted by a combination of 2 Radial Basis Function Neural Network (RBF-NN) models developed with 5 descriptors each, for a total of 8 descriptors (2 are in common between the models). More details about this model can be found in literature (Zhao et al.,2008). The model reached an R2 = 0.83 on the training set, and R2 = 0.80 on the test set.
BCF data have been taken from Dimitrov et al. The original data have been individually checked by at least two partners of CAESAR, and about 10% of the compounds were discharged, as explained in Zhao et al., obtaining 473 compounds.
CAESAR developed more than 100 BCF predictive models based on different algorithms. Some of the best models have been combined to improve performances. The model, which has been implemented, is one of these integrated models. It uses 8 descriptors within an algorithm which has fixed parameters, fully transparent and available at request (coord@caesar-project.eu). Even though sophisticated algorithms have been used in the training phase, during the development of the model and the selection of the descriptors, the final model is a simple one.
The current model calculates chemical descriptors with a dedicated version of the software Dragon, which is commercial software. For this reason, the model runs on a server at Mario Negri Institute and currently cannot be downloaded.
These are the 8 descriptors used by the CAESAR model:
- MlogP - Moriguchi log of the octanol–water partition coefficient (logP)
- BEHp2 - Highest eigenvalue n. 2 of Burden matrix/weighted by atomic polarizabilities
- AEige - Absolute eigenvalue sum from electronegativity weighted distance matrix
- GATS5v - Geary autocorrelation – lag 5/weighted by atomic van der Waals volumes
- Cl-089 - Cl attached to C1(sp2)
- X0sol - Solvation connectivity index chi-0
- MATS5v - Moran autocorrelation – lag 5/weighted by atomic van der Waals Volumes
- SsCl - Sum of all (–Cl) E-State values in molecule

The error of the prediction was about 0.5 Log unit (Standard Deviation of the Error of Prediction), which is of the same range of the experimental variability. The performances of this model were better than those from the EPISuite model for the same compounds.
The results of the CAESAR model do not change considering the different tautomers of the chemical structures.
QSAR Model Reporting Format
Download the QSAR Model Reporting Format for the CAESAR models.
This documentation provide all the information (including the dataset used to build and test the model) to judge the scientific validity of the models.
CLICK HERE TO DOWNLOAD
Scientific validity
The CAESAR model has been assessed according to the OECD principles.- A defined endpoint: The endpoint has been taken from the REACH. Only data produced according to official guidelines have been used (Dimitrov et al. 2005). We used the threshold defined by REACH for the characterisation of the false negatives, and model selection.
- An unambiguous algorithm: Chemical structures have been checked individually by two persons, to have a correct starting point (10% of the structures have been pruned, because not fully correct). Bidimensional chemical descriptors have been used, in order to reduce the variability related to the tridimensional descriptors. Five descriptors are used for the model. We checked that tautomers do not affect the model. The mathematical algorithm is unique and clearly defined.
- A defined domain of applicability: The model is based on a data set of heterogeneous industrial chemicals of about 500 compounds. Some a priori conditions have been defined for the use of the model. The model does not work on mixtures of compounds. The model does not work on complexes. The model works on the neutral form of acids and bases. Some a posteriori restrictions have been introduced, evaluating the outliers. The model has higher uncertainty for sulfonic acids, pesticides, polyhalogenated compounds, chemicals with long aliphatic chains, or ter-butyl groups.
- Appropriate measures of goodness-of-fit, robustness and predictivity: The model has been checked with a large set of statistical criteria, according to Tropsha et al. For external validation, we used an external set of 95 compounds, not used when the model has been developed.
- A mechanistic interpretation, if possible: LogP is the most important descriptor, as expected, and is modulated by other descriptors.
References
- Assessment and validation of the CAESAR predictive model for bioconcentration factor (BCF) in fish.
Lombardo A., Roncaglioni A., Boriani E., Milan C., Benfenati E.
Chemistry Central Journal 2010, 4(Suppl 1):S1 (29 July 2010) - Base-line model for identifying the bioaccumulation potential of chemicals.
Dimitrov S., Dimitrova N., Parkerton T., Comber M., Bonnell M., Mekenyan O.
SAR QSAR Environ Res, 16, 531-554, 2005. - ECOPA REACH animal testing calculator, downloadable at URL: http://www.ecopa.eu/download.php?file=Animaluse_REACH_calculator.xls
- OECD Guideline No. 305. Bioconcentration: Flow-through Fish Test
- REACH implementation project 3.3: Technical Guidance Document (TGD) on Information Requirements on Intrinsic Properties of substances
- A New Hybrid QSAR Model for Predicting Bioconcentration Factor (BCF)
C. Zhao, E. Boriani, A. Chana, A. Roncaglioni, E. Benfenati.
Chemosphere, 73, 1701-1707, 2008.


